Introduction:
In recent years Magnetic Resonance has developed into a very useful and powerful tool in solid state research. In this method, use is made of the Zeeman interaction of the magnetic dipoles associated with the nucleus or electron, when placed in an external magnetic field. Accordingly, they are identified as NMR (Nuclear Magnetic Resonance) or ESR (Electron Spin Resonance). This form of spectroscopy finds many applications in the investigation of crystal structures, environmental effects, dynamic effects, defects in solids and in many diverse branches of Physics, Chemistry and Biology.
Elementary Magnetic Resonance:
We know that the intrinsic angular momentum (spin) of the electron S couples with the orbital angular momentum of the electron L to give a resultant J and this coupling gives rise to the ‘fine structure’ of the spectra. Further, under the influence of an external magnetic field (H) each of the level will split into (2j+1) sublevels (Zeeman effect) andthe splitting of a level will be
DE = (gμ0H)mj
where μ0 is the Bhor magneton, g is the Lande’ g-factor and mj is the magnetic quantum number. As can be seen,the splitting is not same for all levels; it depends on the J and L of the level (s=½ always for one electron). However, the sublevels will split equally by an amount
DE = gμ0H0 or = hn
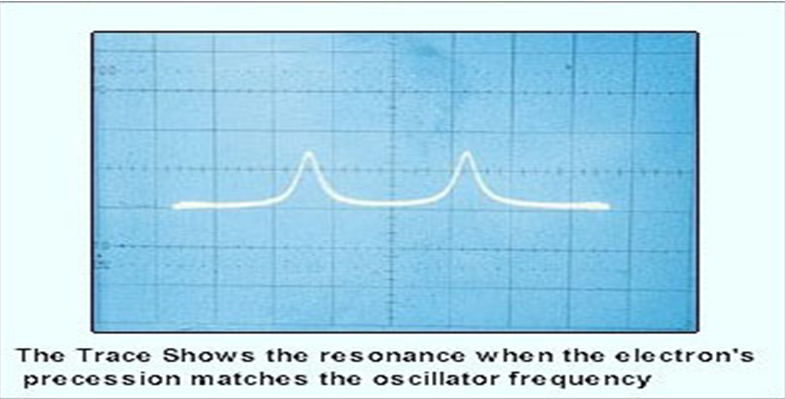
where n0 is the frequency of the system. Now if the electron is subjected to a perturbation by an oscillating magnetic field with its direction erpendicular to the static magnetic field and its frequency n1 such that the quantum hn1 is equal to E=hn0, we say that there is a resonance between n1 and n0. This will induce transition between
neighboring sublevels (mj = ±1) and in turn will absorb energy from oscillating field. Thus, at resonance, we get a peak due to the absorption of energy by the system.
Experimental Technique:
If we consider a free electron and substitute the proper value of constants in the equation: g = 2.00, μ0 = 0.927X10- 20 erg/gauss & h = 6.625 X l0-27 erg sec, we get
n0
— = 2.8MHz/gauss
H0
That is ESR can be observed at radio frequencies in a magnetic field of a few gauss or in the microwave region in a magnetic field of a few kilogauss. The latter alternate has many advantages: improved signal-to-noise ratio, high resolution etc. and is always preferred for accurate work, though it is very sophisticated and expensive. However, if the basic understanding of the subject is the main criteria as is usually the requirement of class room experiments, the observation of ESR in low magnetic field and in a radio frequency region makes it a lot simple, inexpensive and within the reach of every post-graduate laboratory.
Description of the ESR Spectrometer:
A block diagram of the ESR Spectrometer is given below in Fig. 1, and a brief description follows.
Basic Circuit:
The first stage of the ESR circuit consists of a critically adjusted (marginal) radio frequency oscillator with 4-digit frequency display. This type of oscillator is required here, so that the slightest increase in its load decreases the amplitude of oscillation to an appreciable extent. The sample is kept inside the tank coil of the oscillator, which in turn, is placed in the 50Hz magnetic field, generated by the Helmholtz coils. At resonance, i.e. when the frequency of oscillation equal to the Larmour’s frequency of the sample, the oscillator amplitude registers a dip due to the absorption of power by the sample.
This obviously, occurs periodically four times in each complete cycle of the supply voltage. The result is an amplitude modulated carrier which is then detected using a FET demodulator and amplified by an op-amp circuit.
Highly stabilized and almost ripple free power supply for the above circuit is obtained using an integrated circuit regulator.
Phase Shifter:
This can compensate the undermined phase difference which may be introduced in the amplification stages of spectrometer and oscilloscope.
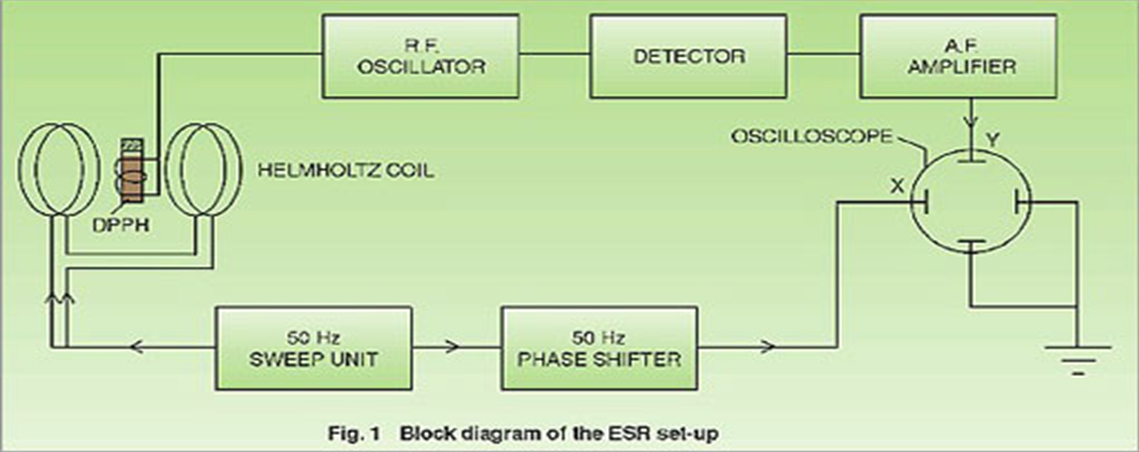
50Hz Sweep Unit:
A 50Hz current flows through Helmholtz coils which provides a low frequency magnetic field to the sample. As the resonance is observed at few gauss only, no static magnetic field is applied.
Oscilloscope (not supplied with the Spectrometer):
Any inexpensive oscilloscope normally available in the laboratory would be quite suitable
Advantages and Limitations of our Spectrometer:
1. The instrument is basically designed for postgraduate laboratories keeping in view their requirements and limitations.
2. The observation of ESR at low magnetic fields and consequently in radio-frequency region makes its instrumentation and working a lot simple and within the reach of a postgraduate students. Good resonance peaks can be obtained as a class room exercise.
3. The spectrometer is complete in all respects including a sample DPPH (except a CRO).
Note: There may be any change in specification due to continuous R & D without notice.
Click below to view catalogue
.png)